


Satellite Precipitation
Motivation
Precipitation is the key hydrologic variable linking the atmosphere with land surface processes, and playing a dominant role in both weather and climate. Three fourths of the heat in the atmosphere is contributed by the global release of latent heat, while the distribution of water vapor and clouds control the radiation balance (WaTER, 2002). Regional precipitation plays a major role in weather patterns and is, of course, the major renewable source of fresh water (both liquid and frozen). Too much precipitation, or too little, can cause significant damage to life and property through floods and droughts.
The first milestone on the NASA Earth Science Enterprise strategic roadmap is, therefore, to "establish a benchmark for global rainfall" (ESE-Strategic Plan, 2001). In fact, because accurate high-resolution precipiation data are necessary for improving our understanding of climate, weather, and hydrology (and for a proper assessment of the human dimension of climate change and variability), the need for systematic measurements transcends the need for process studies. With this in mind, the NASA Global Water and Engery Cycle Research Initiative (WATER), strongly emphasizes the need to "achieve global measurement of precipitation with sufficient sampling density and accuracy to enable the investigation of statistically robust relationships with observed changes in boundary conditions".
While some regions have a history of ground-based operational measurements of precipitation, poor spatial and temporal sampling over land as well as over the ocean, is the globally prevalent condition. The spatial extent and temporal resolution of ground-based precipitation measurements are inadequate to support the creation of global precipitation data set that can help in detecting trends, or in supporting process studies, let alone conducting adequate evaluation of climate and weather models at global and continental scales. At regional scales, the absence of adequate ground-based networks in key basins (Amazon, Mekong, Nile) hampers effective usage of hydrologic models in support of reliable flood and drought predictions.
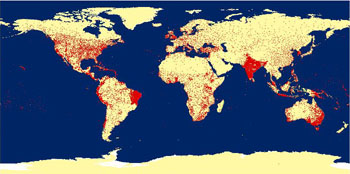
Figure 1. Global distribution of rain gauges with sufficient quality and record length to be incorporated in the Global Hydroclimatic data sets (GHCN). Gauage locations obtained from the NOAA's National Climate Data Center (NCDC).
The absence of adequate ground-based precipitation networks also hampers the development and use of hydroloic models in support of flood and drought prediction, both of which have significant national security implcations. In most parts of the world (particularly in developing countries), radar installations for precipitation measurements are not available while the density of ground-based guage measurements is very sparse. Meanwhile, even in the US, regions with extensive topographic relief, such as the southwestern US, suffer from poor numbers and location of rain gauges while mountains causes large gaps in the coverage provded by radar. In fact, according to a recent study (Maddox et. al. 2002), the actual NEXRAD mountain blockage is substantially more than the theoretical blockage (Figure 2).
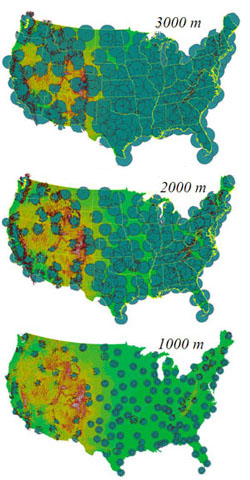
Figure 2. Actual NEXRAD coverage area over the United States. Notice that at 1000m above ground level, the coverage area is much smaller than that at 3000m. As the radar software integrates precipitatoin estimates over several san-levels, the uncertainty associated with the integrated estimates is increased by the inability to capture the reflectivity lower levels, which are closer estimates to ground-level precipitation. Data provided by Prof. Robert Maddox, further information could be found in Maddox et. Al., 2002.
Clearly, satellite-based technologies have the potential to provide improved precipitation estimates for large portions of the world.
Although a number of satellite-based daily 0.25° precipitation products are currently under development by several research groups, hydrologic applications typically require higher spatial and temporal resolutions. For example, sub-hourly to hourly data are typically required for flash flood forecasting and control, daily data are needed for reservoir management, and weekly to monthly data are required for water resources management. The spatial scales required are determined by the sizes of watersheds and sub-watersheds, typically on the order of few square km to hundreds of square km in size.